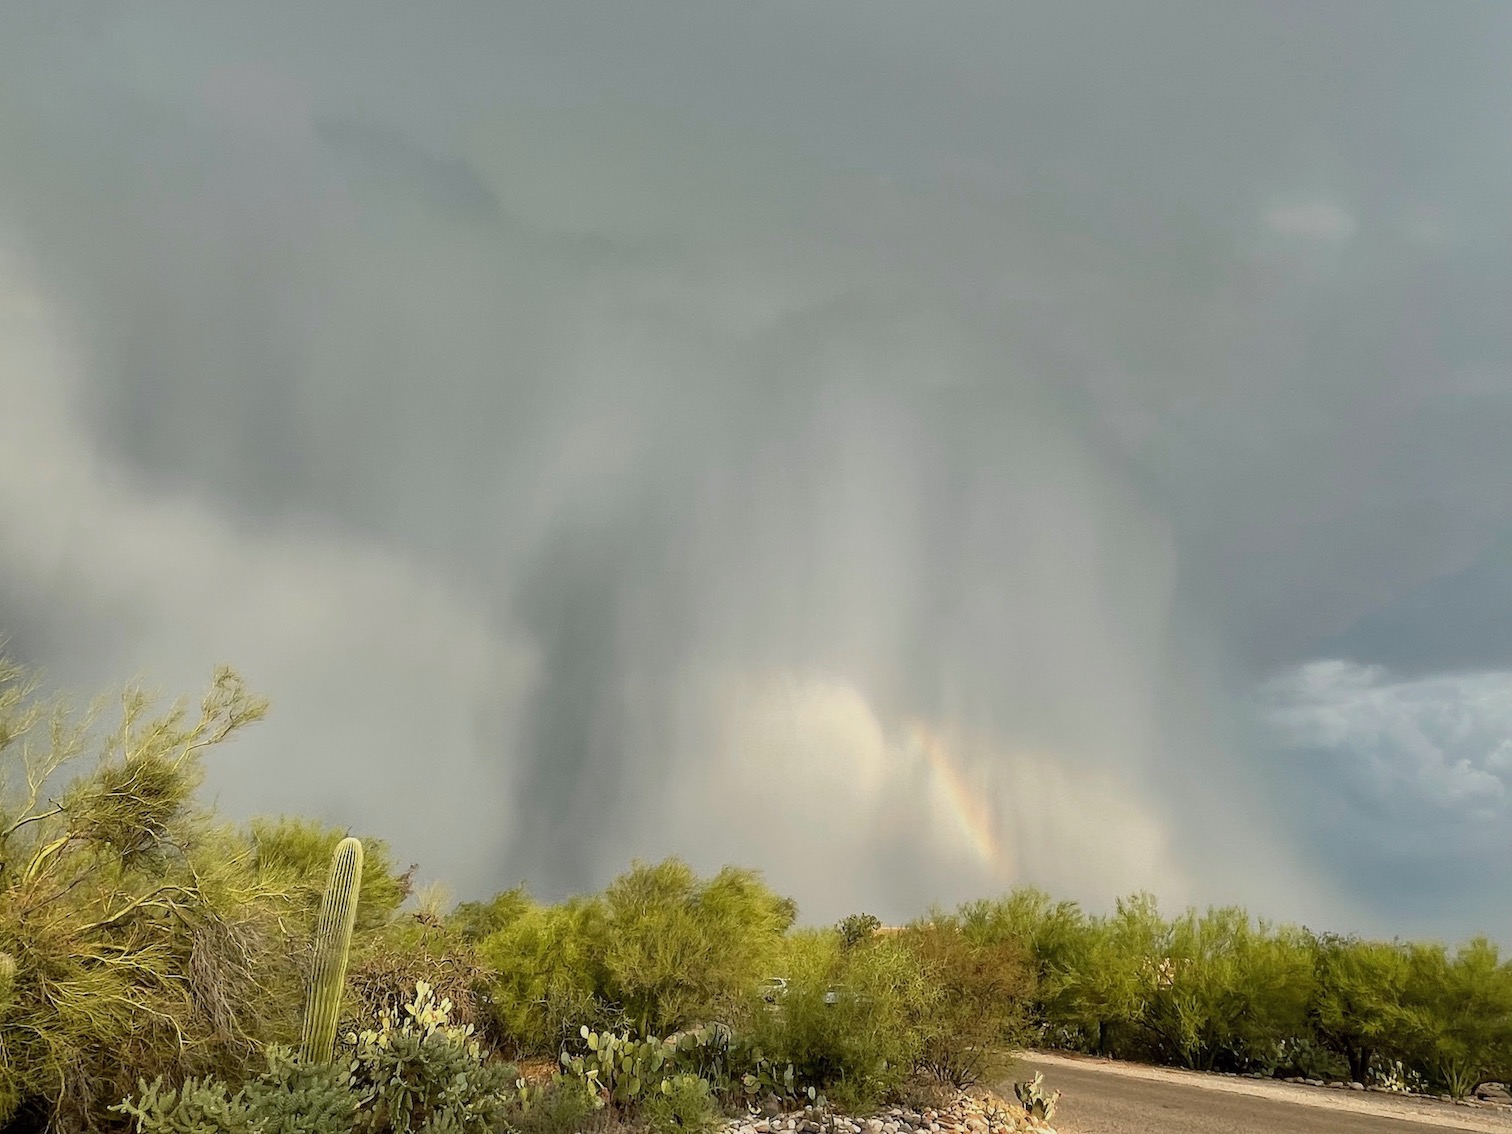
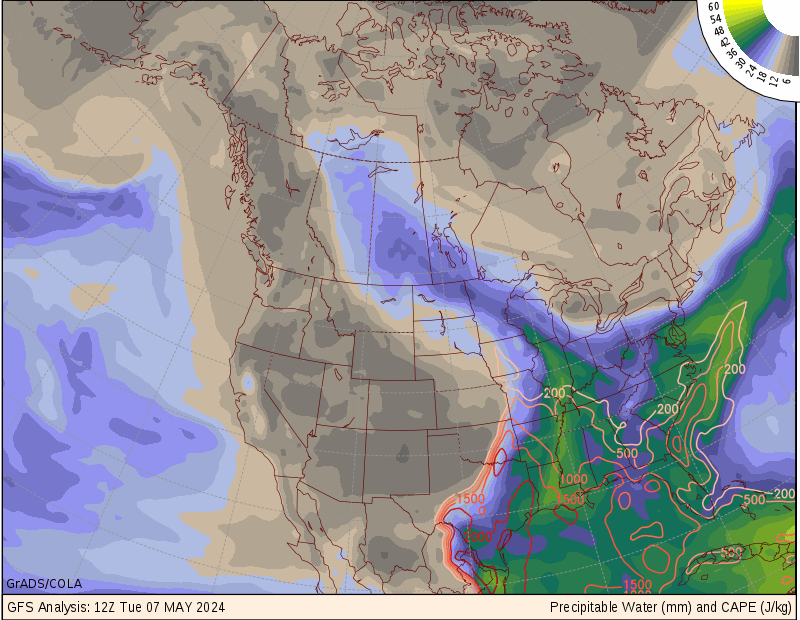
Showing posts with label Monsoon. Show all posts

Monday, June 3, 2024

Clarification of Monsoon 2024 Outlook

This is not a clarification of my own outlook, which I haven't comitted to (yet), but a clarification of reporting about other outlooks. On the weekend of June 1-2 the Tucson paper published online a story headlined, 2024 Monsoon outlook: Hotter, drier summer in Tucson.

The story repeatedly refers to something it calls the National Weather Service 2024 Monsoon Outlook, which the story says was newly released last week. I'm not familiar with such a product, but stand ready to be educated. I'm guessing that most of the time the reporter is summarizing and interpreting Climate Prediction Center three-month outlooks for Jun-Jul-Aug and Jul-Aug-Sep. I'll comment more about this later.

The fourth paragraph of the Tucson story reads,
Last year was the 17th-driest monsoon across Arizona since 1895, according to the National Weather Service 2024 Monsoon Outlook. Tucson received only 4.73 inches of rain in 2023 or .96 inches less than average, National Weather Service records show.
There's that mysterious (to me) Outlook reference again. Last year's 4.73 inches was the 39th driest in Tucson since 1895 (NWS Tucson -> Monsoon -> Monsoon Stats -> scroll to "Haywood plot"), a far cry from 17th driest. My impression of last year's monsoon in Tucson is in line with how it was summarized by azcentral. After they reported how dry Sky Harbor airport had been during the 2023 monsoon, they wrote:
As a whole, the deviation from the norm for Tucson is not that negative. A typical season usually produces around 5.7 inches of rain for Tucson's airport, coming mainly in July and August. This was mirrored in 2023, as the prime months brought 2 and 2.39 inches, respectively, making up for a zero in the June column and a lackluster September.

It's important to remember that the Climate Prediction Center issues outlooks that provide probabilities for three categories: bottom 1/3, middle 1/3, and upper 1/3. Last year's Tucson monsoon coming in at 39th driest since 1895 puts it in the bottom 1/3 (i.e., 1895-2023 = 129 years, bottom 1/3 = 43 driest years). The current CPC Jun-Jul-Aug outlook tilts the odds just slightly toward the bottom 1/3 (33-40% chance), which leaves 60-66% chance for either middle one-third or upper one-third. The CPC outlook for Jul-Aug-Sep is a little more pessimistic, but still leaves a 50-60% chance for either middle one-third or upper one-third.

I agree with two quotes in the Tucson news story from Michael Crimmins: ... forecasting the monsoon is incredibly hard and ... the summer impact of La Niña on the monsoon is actually quite weak.

My bet, or maybe it's just wishful thinking, is that above normal temperatures that are expected to persist over New Mexico will instead by July have shifted a bit toward north Texas. The circulation around the southwest side of the associated upper-air area of high pressure (what media have taken to calling a heat dome) would favor squall lines on several days sweeping across Tucson during the afternoon and early evening, effectively squeezing out available moisture. That's a pattern that has been lacking in recent years, but it's due.

Saturday, July 29, 2023

Severe Thunderstorm Views, July 28

At 556 pm MST on Fri Jul 28 2023 the National Weather Service issued a severe thunderstorm warning covering much of the Tucson area. The storm was located at the time over Sabino Canyon Recreation Area. The warning stated cell movement as southwest at 15 mph. My place is about 7-8 miles due west of the recreation area. (At the time I only heard a radio host's summary; details of the warning looked at much later.) It was about 6:10 pm before I heard thunder and went out on the patio to take a look. Then it took another 5 minutes to realize that I should go back in and get my phone to take some pictures.

The format for the image captions is MMDDHHMMSSPM. MST is GMT -7H. The thunder was coming from the anvil overhead. Maybe I was too far away and it was too bright, but I never noticed any cloud-to-ground lightning. The bright white blob on the right screamed hail. I quickly realized that the action was shifting south. The remainder of the images are looking southeast.

There were widespread reports of inch or more diameter hail on Tucson's east side.

And 60 mph wind gusts at both airfields on the distant right.

Awesome arch of darkness.

On going outside at 6:10 pm I was still in the excessive heat northwest wind. By 6:20 there was occasional moderately buffeting outflow and a few drops of rain. Later about 10-11 pm a secondary band of showers moved through, but for the entire evening I received only 0.01 inch of rain.

Saturday, September 4, 2021

A Tale of Two Noras

A Tale of Two Noras

During the late afternoon hours of this past Tuesday the precipitable water values around Tucson and in all directions away from Tucson were about as high as they ever get. For good reason the National Weather Service had a flash flood watch in effect for Tucson. Below is what about as high as precipitable water values ever get around Tucson looks like.

I use a color range maxed out at 1.7 inches because at Tucson's elevation it doesn't get much higher, and attention is usually on the transition from slightly below to slightly above one inch. Obviously on Tuesday in order to get to the one inch neighborhood you had to go a long distance, either to the highest elevations in the sectors north through southeast of Tucson, or to the moderately high elevations of the Baja peninsula.

By Tuesday Nora's circulation had completely dissipated at all levels, leaving a broad and deep southerly flow at low to mid levels that was continuing to transport moisture northward. The mid level southerly flow veered to a 70+ knot southwesterly upper level jet extending across northern Baja just south of the California border. I picked up about half an inch of rain during the evening hours of Tuesday tapering off into the first few hours after midnight on Wednesday. Most of the eastern part of Tucson, east of about Swan Road, picked up about an inch. By sunrise on Wednesday the threat was past Tucson. The sky was clearing from the southwest as precipitable water levels were already dropping. It was obvious from the large scale radar composite that the upward motion associated with the upper level jet had shifted north and east of Tucson. The radio station that I listen to in the morning continued to report the forecast of a 40-50% chance of rain, but the on-air personality simply ignored the fact that officially the flash flood watch was still in effect for Tucson. The local paper took the opposite tack. The following morning, 24 hours later, the Thursday online edition still featured a story, last updated 21 hours earlier, detailing the flash flood preparations, without noting that the watch had finally been cancelled 18 hours earlier.

One week ago, when the final details of Nora itself were still uncertain, but the threat of flooding for the Southwest was already being publicized, the local paper recalled its snarky coverage of the 1997 edition of Nora, which produced only a few drops of rain in Tucson instead of the 6, 4, 2 inches that had been forecast. The 2021 paper claimed, It's possible the same thing could happen with Nora 2.0.

Here is what the precipitable water looked like on the afternoon of September 25, 1997, the day before the snarky 1997 newspaper article.

By that afternoon the low level circulation of 1997 Nora had had a complicated interaction with the Baja peninsula as Nora-1997 moved rapidly north toward the north end of the Gulf of California. Thick high level outflow debris clouds had overspread Tucson, darkening the sky dramatically compared to the morning sunshine. The wind had become a bit gusty from the south-southeast. I recall walking across the U of A campus with a colleague, a hydrologist, and he mentioned the anticipated (by anyone following the official NWS forecast) heavy rain. I said, "I wouldn't be surprised if we don't get anything." My colleague looked around at the overcast sky and at the effects of the wind gusts and sniffed, "Well obviously the hurricane is coming." The problem is that a hurricane and its environment can't be conceived as a system analogous to a baseball traveling through the air. If the hurricane and its far-flung moisture field were like a solid body, then the precipitable water would have increased dramatically at Tucson as the center of the hurricane raced north. In fact precipitable water did increase during that day over the western half of Pima County, but remained almost constant around Tucson from morning to evening, consistent with what the operational numerical models of the day had been predicting. Even scientists, who should know better, will stick with a conceptual model that is wrong long past the point when reality has given them an answer they didn't want to hear.

Access to the reanalysis dataset through NCAR is gratefully acknowledged:
National Centers for Environmental Prediction/National Weather Service/NOAA/U.S. Department of Commerce. 2005, updated monthly. NCEP North American Regional Reanalysis (NARR). Research Data Archive at the National Center for Atmospheric Research, Computational and Information Systems Laboratory. https://rda.ucar.edu/datasets/ds608.0/. Accessed 28 Aug 2021.

September 17: Corrected paragaraph before second figure, September vs. November.

Monday, August 9, 2021

Mesoscale Analysis

Forty-some years ago analyzing an upper-air feature like this would have been more about art than data. Fortunately the experienced NCO forecasters who I worked with back then were incredibly perceptive artists. The main source of good data at that time was the FPS-77 radar at Davis-Monthan. The scant information on the upper air charts had to be finely analyzed to make sense of the situation. Now we have the Global Data Assimilation System, output available at a horizontal resolution of 0.25 degree (pixels roughly 25 km on a side), vertical resolution 50 mb or better, every six hours. Tucson is roughly near the center of the images below. The five 500-mbar images span the 24-hour period between midday yesterday and midday today. I haven't yet figured out how to make a loop. But anyway I think the evolution of this wave is best enjoyed one frame at a time.

A wind speed max at midday yesterday over extreme western Chihuahua was by early this morning anchoring the eastern side of a distinct trough, which was centered on an axis extending southwest-northeast through Arizona's Santa Cruz and Cochise Counties. Moderate precipitation was roughly aligned with the wind speed maxes, wrapped around the trough. Probably the evolution of the precipitation, and maybe of the trough itself, was tied to the availability of moisture. The images below show the precipitable water for midday yesterday and midday today. What was striking already yesterday was how the highest values of precipitable water, pegged out on the color bar at >1.7 inches, had pressed into the foothills of the mountains in east-central Sonora. Of significance for the coming days is that southwest New Mexico and northern Chihauhua have moistened since yesterday, even as central Chihuahua has dried.

Sunday, March 21, 2021

Winter 2020-2021 Tucson Rain

Winter 2020-2021 Tucson Rain

A few days ago in an Associated Press story about the Climate Prediction Center's Drought Outlook for the Spring season, the story's lede was that the official forecast offers little hope for relief in the West. The story goes on to explain that the drought in the Southwest has developed from a combination of La Niña dry weather [this winter] coming after, in the words of the source NOAA press release, the failed 2020 summer monsoon.

As far as Tucson is concerned, April through June never offers hope for drought relief. These upcoming months are normally the driest three-month period of the year in Tucson, averaging less than three-quarters of an inch of rain total for the three months combined. The official seasonal outlook puts Tucson in equal chances for below normal, near normal or above normal precipitation for this April through June.

There are still a couple of slight chances for measurable precipitation over the remaining ten days of this month. But they won't make much difference for this November through March period, where the Tucson airport has had 1.42 inches, about 2 inches below average. It could have been worse, considering that it was a moderate La Niña (ONI -1.1 for January 2021). This was the worst winter for precipitation in Tucson since 2010-2011, which was also a moderate La Niña.

At my place I've done a bit better than the airport, 2.59 inches for November through March, but still a big drop off from the previous two winters. The summers following big winters may be just coincidences, but if last summer's monsoon deserved an F grade, the previous summer (2019, at least until after Labor Day) was a D. There's no reason to think that this coming summer won't be at least near normal, at least a B or a C, offering a little hope, though still three months away--this summer's monsoon can't be any worse than last summer.

Monday, October 12, 2020

Analyze The Cap

Tucson's weather this winter will be exceptionally boring—one beautiful sunny day after another—thanks to a La Niña that is as certain as a Joe Biden win, according to outlooks from the Climate Prediction Center and The Economist online. Hopefully we'll get a few inches of rain this winter, not too far below normal. But that likelihood will be only half of what Tucson received in each of the last two winters.

So I'll be spending this winter revisiting the few exciting monsoon days from this past summer, and preparing and hoping for more of those days next summer. My most recent previous post here was on July 8. Three days later on Saturday, July 11, the monsoon made a dramatic appearance around sunset. A line of thunderstorms moved from east to west and resulted in several reports of high winds and damage in the Tucson area, including a 60 mph wind gust at Davis-Monthan Air Force Base. But the days immediately before and after July 11 had a similar weather pattern, and those days were just hot.

The selection of a "forecast problem of the day" as practiced by the National Weather Service amounts to wearing blinders. Typically the problem stated in a NWS discussion is confined to one element, for example "will the high temperature be a degree above or below the record" or "will there be damaging thunderstorm winds?" My gripe is not just that wearing blinders is a poor practice for a forecaster analyzing and monitoring the weather situation, it's that the fixation on a single element carries over to the public forecast, a communications disservice. The problem selected for attention on most summer days should be the underlying feature affecting multiple elements, "what is/will be happening with the cap?"

The cap of concern in the Southwest summer sits around 400-500 mb, as noted in the previous post here, or in terms of dry isentropic levels around 326-336 K. It persists most of the summer, yet can vary—in thickness and/or in height—from day to day and even hour to hour, and the variation can be on small as well as large horizontal scales. Let that stable layer subside several hundred meters, with mixed layer moisture overshooting into dry air at the base of the cap, and suddenly there is space for a record high temperature. Conversely lift that layer several hundred meters, and suddenly thunderstorms. Over the next several months I'll be examining available products that might help with what should be the mantra, "Analyze the cap."

Wednesday, July 8, 2020

Wrong Drumbeat

The Tucson National Weather Service is yet again fascinated and fixated on forecasting days ahead of time record-breaking highs, confidently predicting that Sunday's high will be not just 4 degrees warmer than today's (Wednesday's) 107, but precisely 7 degrees warmer. Dismissed is the more important point that unlike the last several afternoons, which have been just hot, the next several afternoons will be both hot and humid.

I have become fascinated with the "Forecast Soundings" option on the National Weather Service Model Analyses and Guidance page. It's fascinating to watch—not just every 12 hours, but every 3 hours—Tucson's capping inversion at around 400-500 mb evolve diurnally, and from day to day. That inversion rules out nearby thunderstorms today. But the mid-level inhibition becomes much weaker possibly as early as tomorrow afternoon, more consistently by Friday afternoon, along with a flow that would steer isolated, high-based, borderline thunderstorms from the east or southeast. The odds of measurable precipitation reaching the ground any of the next several days are low. But the record or near record hot environment will enhance negative bouyancy of any downdraft. Maybe by the end of the weekend the surface parameter that will have been observed to break a record will not be temperature.

Sunday, June 14, 2020

The continued inanity of June 15th

Nine years ago I railed, twice in the same month, about the silly season of talk about the monsoon. In the second of those June 2011 posts I wrote (misspelling site for sight):

Suppose that someone had lived in Tucson for a couple of decades, then fell into a Rip van Winkle sleep for another couple of decades, and finally awoke last week. Rip van Winkle would be bewildered to hear that the monsoon starts Wednesday, and that, alas, despite the approaching start date there's no rain in site (as if rain in site would be normal for this date in June). As terrible as the wildfires have been this year, and as good as it would be to get enough rain to relieve the situation, that's not a realistic hope this early.

The difference this year is that June 15th arrives on Monday, not Wednesday as it did in 2011. It's still silly to talk about the monsoon starting on June 15th, despite a decade of the National Weather Service pretending otherwise.

At this point it might be enough to say, "See previous posts." But following after this April's remininiscing post, this post goes back forty-some years to the weather station at Davis-Monthan Air Force Base here in Tucson. Since the stations's weather radar and human eyes both had a relatively clear line of sight to the south, at this time of year it would not be uncommon for the weather observer to include in a late afternoon or early evening hourly weather observation an uncannilly precise remark that a thunderstorm cloud was being visibly observed 95 miles to the south. So there was no ignorance about moisture pooling in Mexico. But when a trough in the westerlies would briefly pull some of that moisture north and generate a thunderstorm or two, customers would be briefed that, "That was not the monsoon." Emphasis was on the long-term correlation between the north-to-south transition from dry to moist air and the north-to-south transition from westerly to easterly upper-level winds. Thunderstorms, at least scattered coverage, moving generally from east to west, day after day (or at least most days)--like pornography, Tucsonans know what they expect from the monsoon. And until recent decades forecasters understood how to tailor and communicate their monsoon call for locals.

I have no qualms about a firefighter labeling the entire difficult month of June as a nebulous and agonizingly long period known as "at the start of the monsoon." But I doubt a firefighter would insist that the lightning strike on the evening of June 5, which sparked the Bighorn Fire, was "not the monsoon" while at the same time insisting that a lightning strike tomorrow evening would be "the monsoon." That would be just silly.

Monday, July 29, 2019

Hot July

Hot July

In a few days the Weather Service in Tucson will issue a summary specifying, to the nearest tenth of a degree Fahrenheit, exactly how much the average high temperature this July exceeded the current 30-year average. While that number alone should make eyeballs pop, consider also the frequencies of the highs that will have contributed to this month's average. At the Tucson Airport through July 28, the number of days with high temperatures: 1-110, 1-109, 3-108, 1-107, 3-106, 4-105, 2-104, 6-103, 1-102, 3-101, none exactly 100, and only 3 days less than 100. That distribution occurring in June would still be a bit on the warm side for that month, but not so unusual. And in June it is a dry heat, with a good cool off at night. In contrast this month's humidity has been at monsoon levels for the last few weeks. But the rain amounts have not.

When averaged over the years the monsoon daily rainfall peaks this week, and then begins to taper off, slowly at first and then more rapidly toward the end of August. But this July when the upper high has been in its good position to the north it has been too broad--too warm aloft and on most days not enough vertical wind sheer to support organized lines of storms sweeping across the area. Things may change for the rest of this week.

The fact that on average the monsoon peaks about now may not be entirely coincidental with the fact that today, July 29, is Rain Day in Waynesburg (where I was born), Pennsylvania. Don't think they've had any rain yet today. But a sprinkle just before midnight tonight would count, and they may get that.

Sunday, August 26, 2018

Missing Middle of the Monsoon

Every year in Tucson people complain about the current monsoon—not like the ones they remember. That's an accurate perception; it isn't just a matter of recalling only the spectacular days. Each monsoon has a different variety. Some years feature squall lines that roll across the metro area between 3 and 5 pm, others chaotic distributions of evening storms, others organized nocturnal systems, others breaks when the monsoon completely shuts down—each of these more frequently in some years and less in others. So judging this year is not like the others is usually justified.

It's generally recognized and understood that during the shoulder seasons of the monsoon, early July and the weeks around Labor Day, rain totals can be erratic. Erratic is even better understood for the off-seasons, late June and mid-late September. Intrusions of tropical moisture if they happen in the off-seasons are appreciated; if not, oh well. But usually over a four week period near the middle of the monsoon, the last half of July and the first half of August, one way or another the idiosyncrasies of that year's monsoon generate a rain total that meets expectations. That did not happen this year. (My house is 12 miles north of the Tucson Airport.)

2018 Period# daysMy house, inchesAirport, inches
June 15 and 1621.760.91
July 5 to 15110.981.77
Jul 16 to Aug 13291.011.15
Aug 14 to Aug 25121.262.05

Until two weeks ago this year the usual quips about the non-soon had given way to bitter comebacks, What monsoon?!, or as someone on my community's listserve wrote sarcastically on August 11, Our trees/shrubs are just loving it!! G RRRR!

Since the current official definition of the monsoon includes June 15, as well as all of September, and since September is expected to be above normal, it's likely that the official rain total for this year's monsoon will look reasonable. But no matter how much rain arrives in September, it won't wash away the reality of a missing (less than 0.04 inch per day) middle of the monsoon this year.

Tuesday, July 11, 2017

Monsoon Is Here; and Why It's Fun to Watch

Last evening around 6:30 I got several big drops with just a little thunder. A second round of storms mostly fizzled before 9 pm as it came across the mountains out of the northeast. Finally after 10 pm a light rain barely wetted the ground at my place. The 10:30 radar depicted that the second round had developed new convective life after it reached I-10; the brief stratiform rain at my place appeared to have built back from that slight rejuvenation. The same radar showed a few short lines persisting about 50 miles upstream. I went to bed. The third round came through about 1:30 am, preceded and followed by over an hour of loud thunder reverberating off the mountains and everything else. (Fortunately anguish about confident all over for tonight forecasts is well behind me, and it will be easy to fit in a nap today. The local media had mixed messages on their 10 pm newscasts, apparently depending on whether they had noticed the 9:55 pm NWS discussion.) It must have rained off and on for much of the rest of the night. I got 0.65 of an inch.
Ealier, between rounds one and two, at about 7:30 a radio alert announced that a severe warning had been issued for an area centered on the intersection of Alvernon-Drexel, 12 miles south-southeast of me. I went out to take a look, and spent several minutes jealously admiring a rain shaft intense enough to produce a bright rainbow even in the setting sun.
By the time I went inside to get my iphone, the rainbow had faded to what can be seen above. The Alvernon-Drexel intersection is to the right of the rainbow and about twice as far out. There was occasional-to-frequent lightning in that cloud to the right; none of my shots captured it.
A short time later overhead the setting sun was putting high contrast on mammatus under a mostly dissipated anvil.

Thursday, August 20, 2015

Budapest Flooding

On Monday evening Budapest received over three inches of rain in one hour. The results are characterized in online news articles as apocalyptic and tsunami-like. Those Budapest scenes look a lot like Tucson at this time of year in most years, although not so much so far this year. Hopefully in Budapest they've recovered in time for Hungary's national holiday today. Coincidentally, today is also Tucson's 240th birthday.

Monday, August 3, 2015

Upcoming El Niño Seasons

Here in Tucson the rain for the past week finally met expectations. But already, even before the monsoon begins to wane, attention is turning to the upcoming El Niño seasons. It will be interesting to see if the consensus outlooks hold for a strong El Niño to develop and persist through the winter. Whatever the strength of El Niño may turn out to be, the evolution of the weather patterns will be fascinating.
I was preparing to update a five-year-old plot and accompanying rant concerning winter precipitation variability here in Tucson, which I had made back when a La Niña was on the way. But a few days ago the local paper had a tantalizing story discussing the prospect of an active tail-end to the monsoon this year, because El Niño.
So I decided to see what the actual numbers look like. Traditionally September rains would be considered the tail-end of the monsoon, and a tropical system in early October would be beyond the monsoon. Actually, that's still the official definition. Instead of trying to separate the two, I totaled the precipitation for the two months of September and October. The precipitation data are from the Western Regional Climate Center. I used the latest, official definition of the calculation of the Oceanic Niño Index by the Climate Prediction Center. There are a total of 65 years on the plot. Selected specific years are labeled.

I hope that nobody tries to fit a straight line through the plotted points. If this year's October ONI is greater than +1.0, as present trends and most projections suggest, what does history tell us about what to expect? On the plot, there are eight years with an October ONI greater than +1.0 (the right one-third of the plot). For seven of those eight years, the combined total September-October precipitation was at least 1.7 inches. In contrast, the left two-thirds of the plot contains 57 years with an October ONI less than +1.0. Of those 57 years, nearly half had less than 1.7 inches, and two of those years had no measurable rain in either month. So this year, bet on more than 1.7 inches in September-October, because you will have a very good chance of not losing that bet. But another way to summarize the right side of the plot would be to say that in six out of those eight years, precipitation was within plus or minus one half inch of the 65-year mean, which is 2.21 inches. On the other hand, one might choose to go with a persistence forecast, imagining that whatever factors contributed to last year's, i.e. 2014, September-October precipitation performance, those factors are only better this year, and thus the decade of the 2010's might join the 1970's as star contributors toward the upper right quadrant of the plot.
Citing 1972's disastrous tropical system Joanne as the kind of thing that could happen this year would at least be the right analogy--both years with oncoming strong El Niños. Citing 1983's September-October disastrous sequence of events as an example of what can happen in an El Niño year, while discussing this year's high and rising ONI's, is mixing apples and oranges. The 1983 data point would support imagining a big September-October next year. That data point is the only big year making the argument for a lagging effect in September-October from the previous winter's El Niño. But then 1972 is the only data point arguing for a big September-October this year. Certainly the possibility of disastrous flooding triggered by tropical systems in September and early October is a concern, but it should be a concern most years. Dangling the notion that that concern should be higher in Tucson this year because a strong El Niño is developing is not supported by the data.

Monday, June 16, 2014

Reforecasts

Ensemble reforecasts (Hamill et el., 2013) are available at the NOAA ESRL site. The site also provides real-time forecast data and real-time products, the latter having been calibrated based on the historical performance of the reforecasts. Among their list of products is an option to generate plots for a user-selected point displaying time series of the ensemble forecast spread of precipitation and temperature. The precipitation time series for my favorite point (32N, 111W; Tucson) have been consistent over the past week or so. Out of eleven members of the ensemble only one or two have been generating small amounts for tomorrow, roughly in agreement with the latest short-term model guidance of 10% POP (slightly higher chance of thunder) for tomorrow and Wednesday. The ensemble spread product is currently showing the next chance of small amounts of precipitation starting around 28 June.

Off and on I have been exploring how well the reforecasts handle fluctuations in precipitable water (PW) in and around Arizona, focusing on a month-long period centered around [the traditional Tucson understanding of] the start of the monsoon. I have been using the model initial conditions as verification. The data displayed in the figure below are from the initial conditions for the grid cell (T254 = 0.47 degrees lat/lon) closest to Tucson.

The figure contains three horizontal dashed lines for reference. Besides the line highlighting one inch of PW, the other two lines are labeled with approximate late-afternoon surface dewpoints (with a typically dry mid-level cap). There are 29 years of initialized data (and reforecasts, not shown), 1985 through 2013. Of those 29 years, 7 of the years on the indicated day were drier than the 25th percentile, 3 of the years were more moist than the 90th [corr. 1 Jul, original 16 Jun read 10th] percentile, etc. There are some interesting things to notice about the analyzed distribution during this month-long period. At the beginning of the period, on 20 June, only about 10 percent of the years have PW over one inch, while by the end of the period, on 20 July, about 75 percent of the years have PW over one inch. Also, it would be a mistake to look at only the upward trend in the mean, without noticing that the spread of the distribution reaches a maximum around the 4th of July. This large spread results in part from the fact that the dry percentiles (brown) level off for about one week, from 28 June until 5 July. The leveling off in turn is a composite from: (1) a few years that become moist in late June, and stay that way into July; (2) a few years that stay dry into early July; and (3) most years, 18 out of 29, which have a double peak--moistening in late June, then more or less drying out for an extended period in early July. A particularly high-amplitude version of this double peak was in the year 2004, when PW peaked at over one inch on 24 June (putting that year in the top ten percent for 24 June). Then the year 2004 dipped to less than 15 cm from 29 June through 7 July. Anyway, the point about the upcoming transitional period is that the ensemble reforecasts have a difficult challenge to meet in representing climatology, let alone for the forecast in a particular year to convey a sense of which days may depart from climatology.

Tuesday, July 17, 2012

After the Deluge, July 15

Late Sunday afternoon my place got three and a quarter inches of rain. This picture was taken just two hours after the most intense rainfall rate I've ever seen. The pot-of-gold is a couple of miles away in Bob Maddox's driveway.

Monday, July 25, 2011

Dual Polarization, July 7

Many Tucsonans, including me, tend to keep in mind a typical monsoon day. The typical day begins with abundant sunshine, continuing at lower elevations through lunchtime. By that time isolated storms are maturing over the highest mountains. About mid-afternoon new storms assemble southeast of Tucson, then proceed to sweep across town in an organized line, providing most locations along the way with a brief period of moderate to heavy rain. In some monsoon years there might be ten or twenty days approximating that description. Other years there are only a handful. So far this year we have had a good share of reasonably typical days. One of those days was Thursday, July 7.

The rain started at my place just before 6 PM (a little late for a typical day). Over the next 25 minutes the rain rate averaged about 1.5 inches per hour. There was no hail at my house, not even the tiniest trace of slush. There were reports of at least pea-sized hail nearby in several directions. A lady who lives about three miles east told me that her hail was long-lasting. From her description it sounds like some of her hail must have measured at least half an inch.

The time for the two images above is within a minute of when the rain started at my place. In the southwest quadrant of the top image, there is a reflectivity radial which alternates between green and yellow pixels. Beside it is another radial alternating yellow and red. My place is along the gradient between those two radials. At this distance from the radar, about 75 miles southeast of KIWA, the pixels are about 1 km wide in the azimuthal direction. Not surprisingly, given the first-hand description of the hail, there is an area of high reflectivity 4 to 5 kilometers east of my house. For simplicity, I'll call that cell the hailstorm. Fifteen minutes earlier, when that cell had just developed, it was more or less surrounded by a ring of high differential reflectivity. By the time of these images the high differential reflectivities (second image) had consolidated into two arcs, one extending northwest from my house, while the other, smaller area is southeast of the hailstorm. The rain began abruptly at my house with a brief barrage of big drops (higher differential reflectivity). That quickly changed over to a mixture of large and small drops (lower differential reflectivity), all wind-driven from due east.

Looking at what others are saying about dual-polarization, it appears that the emphasis is on dual-pol being an improvement in the classification of precipitation type. Incorporated in that classification is a distinction between different drop size distributions, and that distinction contributes to improved estimates of rainfall rates, for which it is straightforward to quantify the estimated benefits. But in addition, I think that differential reflectivity by itself will provide new information that will contribute to improved nowcasts of storm evolution.

With the heavy rainfall rates and the diversity of hail reports on July 7, it would seem to have been a good day for the other two dual-polarization products, the correlation coefficient and the differential phase, to shine. My initial impression is that there are problems interpreting them, perhaps because my house is too far from the radar. The differential phase seems to be overwhelmed by non-meteorological spatial variability. For the correlation coefficient, there seems to be a stronger meteorological signal. Here is an image of the correlation coefficient at the same time as the previous images.

The correlation coefficient never dropped below 0.97 at my house. It was lower around the hailstorm.

Sunday, July 10, 2011

Phoenix Dual-Pol Radar, June 30

I stumbled on how to access the dual-polarization radar data from the archive at NCDC. Their viewer, the Weather and Climate Toolkit (WCT), in its Moment: pull-down-list conveniently and automatically adds the available dual-pol products to the original three (single-pol) products.

Although there have been several exciting days over the past week and a half, my previous post explained what was interesting about June 30. The day started for me with loud drops falling on the skylight shortly after 4 AM (11 GMT). It was the first rain in a long time. To make the morning even more interesting, the local media thoroughly covered the first uprooted tree of the season.

The two radar images below, which are zoomed into the Tucson area, were saved from the WCT. The top image is reflectivity and the bottom is differential reflectivity. The time is eight minutes before the reported time of the tree uprooting, and it is about a half hour before the big drops woke me. The thin red lines, conveniently provided by the WCT, are the highways I-10 (extending NW-SE) and I-19 (extending to the south). The marker labeled J is my house. The marker labeled M is the corner of Mission and Drexel, near the report of the tree toppling. The distance between M and J is about 12 miles.

The markers labeled with T's are prominent peaks in the Tucson Mountains. I imagine that the heights of the cloud bases were well above those mountains. Yet when viewing animations of both the reflectivity and the differential reflectivity, it's apparent that the cells were feeling the effects of the underlying terrain. Most of them were moving from southwest to northeast, along paths approximately perpendicular to the Tucson Mountains. The cell at M was slow moving, giving the impression of being attached to the southeast end of the Tucson Mountains. It's interesting to notice that the M cell is flanked by an area of bigger drops (higher differential reflectivity) on its southwest side. Now shift attention to an area directly north of M, where there is a cell centered on I-10. Ten minutes later that cell had moved to near my house (point J). By then the reflectivity had decreased by a good 5 dBZ and the differential reflectivity to mostly 2 dBZ or less. A second cell, approaching the top of the Tucson Mountains in this image, was near my house a half hour later. It too had reduced reflectivity by then, and its differential reflectivities had decreased to either slightly above or slightly below 2 dBZ. Perhaps the radar is telling me that the big drops had just finished falling onto my skylight.

Coincidentally, the upper air flow that morning was similar to what is expected for Tucson this coming Tuesday morning. I can see that the models are driving dry air well south of San Diego, then across Baja. There certainly are going to be changes, but I'm suspicious that the break in the monsoon is being exaggerated.

Thursday, June 30, 2011

Big Drops

I would not quibble with anyone who says that this year's monsoon in Tucson got off to an early start on Tuesday (two days ago). Although most of yesterday (Wednesday) fit my picture of a pre-monsoon westerly trough, there were times on Tuesday when things were moving from the southeast. Then this morning a little after 4 AM I awoke to big drops falling on the skylight in the bathroom. The windows were still shut and the air conditioner was running, so it would have been hard for the thunder to wake me. But those big drops sounded like someone pounding on a saucepan with a spoon. (There were a bunch of damp, long-dead bees in my rain gage. It must have been not more than a few hundredths.)

I once remarked to John Marwitz that big drops were the most fascinating things to me about monsoon thunderstorms. John pooh-poohed the notion: A thunderstorm is a thunderstorm. He's right of course. Still I can't help thinking that there's something special about the distribution of big drops in storms west of 105W longitude.

When I first heard about dual-polarization radar about 25 years ago, I would be thinking about those big drops. The electrical engineer, V. Bringi, would fill the blackboard with a fog of phasors. But I would be picturing the old analog scopes on the finicky magnetron-based radar at Davis-Monthan, imagining those scopes magically transformed to show differential reflectivity. I wasn't aware until reading about it on Bob Maddox's blog that the National Weather Service radar in Phoenix (the radar is actually at the old Williams AFB) recently had an upgrade to dual-polarization. Since then I've been trying to figure out if there's a way to access the data. (My house is about 75 miles southeast of their radar; and I'll probably be disappointed with digital vs. old-time analog right next door. Still I think there will be interesting things to see.) In the meantime, I'll be excited to read about the first impressions in Phoenix. Here's an example from last night's Phoenix forecast discussion (FXUS65 KPSR 30035):


ALSO INTERESTING WAS OUR FIRST BETA TEST OF THE PHOENIX DUAL
POLARIZATION RADAR WITH THE NEARBY STORMS. OUR OBSERVATIONS
WERE...NOT A LOT OF PRECIP WAS DETECTED IN THE CLOUD CORES...
MEANING PRECIPITATION WAS IN THE FORM OF LARGE UNIFORM DROPS IN LOW
CONCENTRATIONS. OR VERY LITTLE MIXED PHASED PRECIPITATION
CONCENTRATIONS. SINCE VERY LITTLE PRECIP WAS DETECTED...THERE WAS
NOT A WHOLE LOT OF EVAPORATIVE COOLING ...AND THUS ACCOUNTED FOR
THE LACK OF STRONG DOWNBURST WINDS WE USUALLY GET WITH LARGE
TEMP/DEWPOINT SPREADS...WHICH AT THE TIME WAS 111 DEG OVER 50 F.

Tuesday, June 14, 2011

The Monsoon Onset: What Has Changed?

Suppose that someone had lived in Tucson for a couple of decades, then fell into a Rip van Winkle sleep for another couple of decades, and finally awoke last week. Rip van Winkle would be bewildered to hear that the monsoon starts Wednesday, and that, alas, despite the approaching start date there's no rain in site (as if rain in site would be normal for this date in June). As terrible as the wildfires have been this year, and as good as it would be to get enough rain to relieve the situation, that's not a realistic hope this early. The monsoon itself of course has not changed. There is still much year-to-year and week-to-week variability. The variability would make it difficult to detect long-term changes in the monsoon anyway. But there have been other changes over the past few decades.

One of those changes is that meteorologists across the country recognize the notion of a monsoon in this part of the country. That recognition is thanks to various publications that have established the use of the terms Southwest Monsoon or North American Monsoon to describe the circulation and rainfall changes in the broader region around Arizona. But those broader changes have always been recognized from Arizona. Even before there was an Arizona there were Tucsonans who enjoyed sitting on their patios, peering far into the southern horizon (almost as far as a radar beam can reach), watching thunderstorm anvils and distant lightning, and wondering when the rains would get to Tucson.

Another change over the past few decades is the development of a wider variety of remote sensing techniques for better discerning the distribution of moisture in the atmosphere. The old satellite standby, an image of water vapor, happens to focus on moisture in the middle layers of the atmosphere. It has been joined by extra satellite sensors and by other indirect techniques. All of the remote techniques have their uncertainties. Instead of trying to weigh the uncertainties myself, I rely on depictions of precipitable water (PW) as assimilated into numerical models. Specifically, I like the presentations at COLA's wxmaps.org. Their plots clearly identify key contour levels of PW. When those contours are viewed alongside the old-standby satellite water vapor image, you get some feeling for the vertical distribution of the moisture: whether it is confined mostly to the lower layers of the atmosphere, as is often the case at the very beginning of the monsoon, or whether thunderstorms on previous days have left considerable remnant moisture in the middle layers. If the moisture is mostly confined to the lower layers of the atmosphere, then 25 mm (1 inch) of PW corresponds to a daytime surface dewpoint in the mid-50's. The bottom line is that 25-30 mm of PW is the transition to the monsoon.

Although they are still far from perfect, the model assimilations and forecasts of PW are more reliable than they were a few decades ago, providing a picture of the advance of the monsoon well before it reaches the southern horizon. But once it reaches the International Border, I revert to remotely sensing out on the patio and enjoying the show.

Monday, June 6, 2011

It's Monsoonal Season

The monsoonal season has arrived in Tucson. No, not the two months or so of near daily thunderstorms; that's still about a month away. What's already in full force is the silly season of talk about the monsoon. For the next month Tucsonans will endure media and meteorologists making pronouncements regarding the monsoon in general and the upcoming season in particular.

My peeve is not with the general public. Anyone who has lived in Tucson for awhile understands what the monsoon is about, and when it arrives. It's always fun to talk about the monsoon, and to speculate about the exact date when it will start. Most years the monsoon can be relied on to start within a week of, and usually just after the 4th of July. It's fun to plan on a dry 4th, anticipating a wet 6th, 8th or 10th.

More often than not at least once before the 4th it rains enough to wet the ground in Tucson. Obviously that will be the case when the monsoon arrives early. But there are rare rain days in June or very early July caused by mid-latitude westerly troughs. Traditionally meteorologists in Tucson would emphasize that those days were not the beginning of the monsoon. Their emphasis would be based not only on a diagnosis—that the winds aloft did not come close to meeting the definition of a seasonal wind shift, but also on a forecast—that the rains would not persist right on into the monsoon.

How does the National Weather Service currently define the beginning of the monsoon? I've lost track of the changes. I think that the NWS missed an opportunity a few years ago to reestablish a distinction between the monsoon, when thunderstorms occur almost every day, versus the encompassing summer thunderstorm season, the early part of which is mostly dry but with infrequent and especially hazardous days of high-based thunderstorms.

Although it goes against tradition, there is a case to be made for counting non-persistent June thunderstorms, perhaps racing swiftly off to the east-northeast, as part of the monsoon. The argument would go like this. The associated westerly trough managed to temporarily capture part of the moisture that was pooling south of the subtropical ridge. Climatologically that ridge is in the process of moving north to it's July-August position in Arizona. Parts of Sonora, Mexico, may already be experiencing the effects of a monsoonal flow. Thunderstorms in Tucson during the mid- to late-June period are less rare than earlier in June, suggesting that the northward advance of the subtropical ridge is more relevant than the obstinacy of the westerlies. The case against: those storms are followed by extended periods with no rain.

Tucson is very different from Phoenix in a number of ways. With regard to temporary surges of moisture before the monsoon, the difference lies in the trajectories of air flowing from the west-southwest toward each city. Phoenix is more susceptible to dry air from above the cold waters of the Pacific, say just south of San Diego. Tucson has more exposure to moist air channelled through the central Gulf of California. Temporary surges of high humidity at Phoenix get scoured away within a few days. In contrast, after the initial surge, high daily-average dewpoints may linger for several days in Tucson. It might be argued that persistently high daily-average dewpoints in June, albeit not quite high enough for afternoon/evening rain in the city, should define the beginning of the monsoon. But that definition clashes with what would have been the traditional call (based in part, I re-emphasize, on forecasters making forecasts) as well as my impression of what most Tucsonans think of as "the monsoon". If the monsoon starts this year on July 6, it will not be late. It will be right on time.