Showing posts with label Winter Rain. Show all posts

Monday, March 24, 2025

Tucson Winter Precipitation, Update 2025

Periodically over the last fifteen years I've posted here updates about Tucson's Winter Rain totals. All of those posts can be viewed together under the heading Winter Rain on the right. Please see those earlier posts for additional discussion about the format and content of the scatterplot below. Here I'll just reiterate my contrarian definition of winter in Tucson as being the five months November through March, instead of the conventional meteorological three month winter of December through February. Either way this past winter in Tucson was very dry. The most significant precipitation events during the five-month winter came in early November and mid-March, and those brief "shoulder month" storms were very wintry, with cold rain in Tucson followed by panoramic views of mountain snow cover. The Tucson Airport recorded a total of only 0.86 inches of precipitation for the five months, with only a quarter inch of that from the middle three months.

The last time a five-month Tucson winter was this dry was fourteen years ago, during the moderately strong La Niña winter of 2010-2011 (unlabeled black square near the lower left corner of the plot). Over the last seven years we have had four La Niña winters (unlabeled 2020-2021 and 2021-2022, along with 2022-2023 and 2024-2025, labeled 23 and 25), one strong El Niño winter (2023-2024), one weak El Niño winter (2018-2019) and one winter that straddled the threshold between neutral and El Niño (2019-2020).

This time last year, as the strong El Niño was winding down, models were predicting continued rapid cooling in the critical 3.4 area of the equatorial Pacific, heading toward a moderate La Niña by winter, something like what happened in 2010. But that large swing did not happen in 2024. Instead, ocean surface temperature anomalies in the 3.4 area stalled in the neutral zone for months. Finally in December 2024 the La Niña threshold was barely crossed. (See the ONI section of the CPC's weekly ENSO update). Now in late March the 3.4 anomaly has already crossed back into the neutral zone. Nevertheless, total rainfall in Tucson for the 2024-2025 winter was near the bottom of the historical range for a weak La Niña (over a period of 76 years). For what it's worth, model predictions into the beginning of next winter are keeping the ONI in the neutral zone, drifting back toward the cold side of that zone.

The next post here will be about heat, and not just in Tucson. But that will wait until summer heat is closer, probably around mid-May.

Monday, April 1, 2024

Tucson Winter Precipitation Update

Starting almost 14 years ago I have been periodically posting here a figure similar to the one below. Last year at this time we had just come out of three straight La Niña winters. Now it's time for the scatterplot to incorporate this past winter, which was dominated by a strong El Niño.

Last year's update was the first in a few years, so in that post I reviewed my reasoning about what is plotted in the figure. Please see last year's update for a more complete discussion. The reason I use a 5-month winter for Tucson is that even in a wet winter an entire month can be well below average, and conversely for a dry winter. It's better in El Niño winters to take note of 4 out of 5 wet months, instead of focusing on mid-winter and so sometimes discounting a precipitation total that results from combining only 2 wet months with 1 dry. As it turns out for this past 5-month winter it was November that was the dry month. A wet March made up for November. So for this past season in particular the net impact of broadening the definition of winter from 3 to 5 months was a wash.

On the horizontal axis, the ONI is a number calculated monthly as an objective way to summarize the status of ocean temperatures in a critical part of the tropical Pacific. Since the calculation is a running mean, the most recent value lags by a month. There is also a persistence requirement, as explained by the Climate Prediction Center in their weekly updates. Generally a value greater than 0.5 means El Niño conditions are present, while less than -0.5 is La Niña. This past winter the ONI edged up to 2.0 in December before dropping back to 1.8 in January. See my last update a year ago for more discussion about what I have plotted here. Though the ONI for this month (April) will probably still be in El Niño territory, model outlooks have it falling rapidly to below -1.0 by this October.

The TUS 5-month total precipitation for this past winter was 6.16 inches, which makes it the wettest winter in 26 years, and ranks it 11th wettest of the last 75 years (i.e., of the 5-month winters 1949-1950 through 2023-2024). Last fall, even though an El Niño of moderate (ONI > 1.0) or strong (ONI >1.5) intensity was expected for the 2023-2024 winter, for the West a minority contrary forecast had a near normal outlook for winter precipitation, apparently based on giving maximum weight to recent trends (subsequent to the 1997-1998 winter). Now that the winter of 2023-2024 is a fact, the underperforming winter of 2015-2016 looks even more like an outlier, not part of a new trend.

Monday, March 27, 2023

Tucson Precipitation, Update for the Last Three Winters

Starting almost 13 years ago I have been periodically posting here a figure similar to the one below. Newer versions of the figure incorporate recent years and occasional refinements. The last update was three years ago, so it's now time to add three more winters.

Since it has been awhile, I'll review my reasoning about what is plotted here. Why November through March? In any winter there are always periods of both wet and dry weather patterns. Though some patterns may be fleeting, others may persist for the better part of a month. A three-month winter could equally end up wet-dry-wet, or dry-wet-dry. I think that five months is a better window for capturing the overall winter. Since on average the months of November and March in Tucson are each drier than any of the other three months, in most years it matters little. But when it does rain in Tucson in those edge months, it is basically a winter pattern. Whatever those two months produce, I think their results deserve to contribute to the winter as a whole. So the vertical axis is Tucson Airport precipitation totaled for five months. Before turning to the horizontal axis, notice that the data point for this past winter of 2022-2023 is labeled 23, corresponding to the end of the five-month period, also to the year in January, the middle of the five-month period. That is what I use to categorize the winters by decade. Selected years are also labeled.

The Climate Prediction Center (CPC) issues a weekly update presentation on ENSO, with each update providing, among many other things, an explanation of and discussion about the Oceanic Niño Index (ONI). Summarizing, the calculation of ONI starts with a climate-adjusted dataset of monthly ocean surface temperature anomalies for a key area of the tropical Pacific. These monthly anomalies are averaged over three months (i.e., the January ONI is an average of the anomalies for the months of December, January and February), and then the ONI is defined to be that average rounded to one decimal place. I've repeated the three-month averaging calculation, but since I've rounded to two decimal places, same as the input dataset, technically what I have plotted is not ONI. The difference amounts to no more than the width of a plotted marker. Notice for the dry winters of 2020-2021 and 2021-2022 (unlabeled, cyan-diamond) the horizontal positions of their markers, plotted here with their (pseudo) ONI value rounded to two decimal places. For both years the January (DJF) official ONI rounds to -1.0.

The expectation that La Niña would rapidly diminish toward the end of this past winter was already well forecast at the beginning of last fall by a consensus of dynamical models. Back then it was already clear that the upcoming winter's La Niña was not going to be the same as the previous two winters. This year's ONI for January (DJF) was down to -0.7. The ONI for February (JFM) is not yet available, but will probably be close to the -0.5 threshold. Barring significant amounts of precipitation during the last two days of this month, the five-month winter of 2022-2023 ranks 23rd wettest among the last 74 winters. The decade of the 2020's, even with the two dry La Niña years, is/will be off to a good start (compared to, for example, the decade of the 2000's). There's every reason to expect that next winter's precipitation will be at least near normal, and maybe even above normal again.

Sunday, March 21, 2021

Winter 2020-2021 Tucson Rain

Winter 2020-2021 Tucson Rain

A few days ago in an Associated Press story about the Climate Prediction Center's Drought Outlook for the Spring season, the story's lede was that the official forecast offers little hope for relief in the West. The story goes on to explain that the drought in the Southwest has developed from a combination of La Niña dry weather [this winter] coming after, in the words of the source NOAA press release, the failed 2020 summer monsoon.

As far as Tucson is concerned, April through June never offers hope for drought relief. These upcoming months are normally the driest three-month period of the year in Tucson, averaging less than three-quarters of an inch of rain total for the three months combined. The official seasonal outlook puts Tucson in equal chances for below normal, near normal or above normal precipitation for this April through June.

There are still a couple of slight chances for measurable precipitation over the remaining ten days of this month. But they won't make much difference for this November through March period, where the Tucson airport has had 1.42 inches, about 2 inches below average. It could have been worse, considering that it was a moderate La Niña (ONI -1.1 for January 2021). This was the worst winter for precipitation in Tucson since 2010-2011, which was also a moderate La Niña.

At my place I've done a bit better than the airport, 2.59 inches for November through March, but still a big drop off from the previous two winters. The summers following big winters may be just coincidences, but if last summer's monsoon deserved an F grade, the previous summer (2019, at least until after Labor Day) was a D. There's no reason to think that this coming summer won't be at least near normal, at least a B or a C, offering a little hope, though still three months away--this summer's monsoon can't be any worse than last summer.

Tuesday, March 31, 2020

Another Wet Winter

The numbers are in for precipitation for this 5-month winter of 2019-2020, and it was another wet one. In fact this was the 13th wettest of the last 71 winters. Hopefully the trend of three good winters in the 2010's will continue for the 2020's. Though the January ONI was a bit into El Niño territory, there is a duration requirement which means that when all is said and done the winter as a whole will have been at the high end of neutral territory, not quite enough to be considered an El Niño winter.

This winter's precipitation was skewed toward the first month-and-a-half of the five months. November was 400% of average (1.74 inches above average), while December was 126% of average, most of that in the first half of December. January was 76% of average, while February and March were each close to average. Thus the total for December through March was close to average. But November was the wettest November of the last 71 years. So this winter's good performance was the result of a fast start during the last two weeks of November, combined with the last four months together keeping up not just with the median but with the mean.

Thursday, December 19, 2019

Winter Rain

Here is an update of a figure that I have posted and discussed several times over the past nine years or so. The running total for this 2019-2020 winter, which when it ends will be in a new decade, is off to a good start. As of mid-December this winter has already surpassed the entire, disappointing, strong El Niño winter of 2015-2016.
This winter's ONI is expected to remain on the warm side of neutral territory, just less than the +0.5 threshold that is used to categorize El Niño. This winter's data point may end up shifted a little to the right or left, but probably not by much--the consensus of dynamical model forecasts of (sea surface temperatures that go into calculating) ONI has verified well over the last few years. The only question is how far the point will move up on the vertical scale of precipitation. It would be a shame if this winter ended clustered with the red data points from the 1950's and 2000's. Instead, given the head start, I'll be optimistic that by the end of March this winter will be comparable to 2018-2019.

Friday, March 15, 2019

This Tucson Winter

During this El Niño winter with each storm Tucsonans have been reminiscing about winter rains (and mountain snows) of long ago. People say that this winter is like when I first moved here or when I was a kid. But we need only go back four years to find a winter similar to this one in Tucson.

The scatterplot above is almost the same figure presented and discussed in my post five months ago, but now with this winter included. This November through March five-month period is not complete, and so this winter could yet creep past the one four years ago. Either way, this winter and the one four years ago are the two wettest winters for Tucson since the winter of 1997-1998. Together this decade's three above-normal winters (all El Niños, two of them with ONIs qualifying as weak El Niños) rank 12th, 13th and tied for 16th wettest out of the last 70 years, making up somewhat for the dud strong El Niño winter three years ago.

This year's running total for Tucson Airport for the five-month period November through March stands at 144% of normal. Adding in last year's very wet October, Tucson's running total for October through March stands at 180% of normal. That latter number can be more easily compared with the real-time water-year analyses for the entire Colorado River Basin (under that site's tab Monthly Precipitation; March so far has been very good to the areas in Colorado and New Mexico that missed out earlier).

Saturday, December 1, 2018

Variability—Elephants in the Room

Yesterday morning at 3:15 I awoke to rain, accompanied by occasional faint rumbles of thunder. My dream had ignored the thunder, but had not been able to reconcile the sound of the rain pelting down outside.
The PBS/NPR stations in Tucson spent the day reporting that, National climate experts are still waiting to see whether an El Niño weather pattern will develop. I don't have any idea who may be their source for that statement, but there are multiple problems with it. First of all, national climate experts have been expecting for at least a month now (see links in my previous post) greater chances for above normal precipitation in Tucson this winter, based mostly on the high chance of El Niño being present this winter. The Climate Prediction Center's outlooks are couched in terms of probability over a certain period of time (as are, or should be, almost all weather forecasts of precipitation). It is not a matter of waiting to see what happens. It's true that an official call on the actual presence of El Niño won't be made until a monthly update; the next monthly update will be on December 13. But El Niño being present (as defined by ocean temperatures) is not the same as a particular weather pattern being present. In every season, in every winter, in every El Niño winter there are a variety of weather patterns. One pattern gives way to another. Sometimes a pattern persists for weeks or even a month; sometimes a pattern lasts for less than a week. Over the course of a five-month winter there might be only a dozen or so pattern shifts. When it looks like an established pattern will never change to something else, it seems that's just when it does. Some patterns tend to return more frequently or last longer during an El Niño winter, and those patterns, averaged with the patterns that return less frequently or last for a shorter period of time in those years, result in what is a departure from an average winter. But every El Niño is different. There is no single El Niño weather pattern that develops and then lasts the rest of winter. As surely as some expert will eventually decree that such a pattern has arrived this winter, that decree will be followed by a shift to a dry pattern for a few weeks.
So every El Niño winter is different, and every non-El Niño winter is different. But intra-seasonal variability is not the whole story behind the scatter. The figure below simply repeats the data points plotted in the previous post. But now the color labels are different for the plotted points.
The entire period, beginning with the winter of 1949-1950, amounts to 69 years. In this figure, unlike the one in the previous post, for an approximate middle half of the period, the winters 1965-1966 through 1997-1998, amounting to 33 years, are plotted as green circles. There is a different distribution for the green years compared to the earlier and later periods. In 7 of the 33 green years the January ONI was greater than 1; 4 of those 7 were whopper winters in terms of precipitation. But also, of the 20 green winters that were not in El Niño territory in January, 4 of those winters were also whoppers. (I've always been skeptical of studies that purport to establish a lagged correlation between El Niño and rainfall. The lag works, until it doesn't. It is interesting to notice that 79 and 93 lagged 78 and 92 by one year, and 68 and 85 lagged 66 and 83 by two years. But most of the time a lag fails miserably, even in the green years.)
The end of the period of green years coincides with a shift from a warm to a cool phase of the Pacific Decadal Oscillation. But the start of the green years was near the middle of a cool phase of the PDO.
Although the El Niño winter three years ago was disappointing for Tucson, we've had a couple of winters this decade that nudged into green-year territory. It will be interesting to see what this winter may bring. We'll have to wait and see what will develop.

Wednesday, October 31, 2018

El Niño and Tucson Winters

The scatterplot below is an update of a similar figure presented in my post three years ago.

The Oceanic Niño Index (ONI) is defined and calculated by the Climate Prediction Center [CPC] as a climate-adjusted three-month average of the sea surface temperature anomaly for the 3.4 region of the tropical Pacific. Thus the January ONIs are already averages over the three months of December, January and February. Historical calculations now use version 5 of the CPC's reconstructed sea surface temperature dataset. The figure that I presented three years ago was from version 4. In some cases the plotted points on this figure have shifted a few tenths of a degree left or right from where they were three years ago. But the overall scatter remains the same. This updated figure includes the last three winters. The last two winters would be labeled 17 and 18, but those two points are packed (unremarkably) among similar years having negative ONI with below average precipitation. (For all 69 years, the mean of the five-month total precipitation is about 3.7 inches; the median is about 3.3 inches; the upper one-third starts at 4.1 inches.) The winter of 2015-2016 (labeled 16) is remarkable because though it is the rightmost point, it is also below average.

Being a three-month running average, the September ONI that will become available at the CPC site tomorrow will lag the latest developments. According to the weekly updates from the CPC the 3.4 anomaly has climbed rapidly in October so that for the latest week it stands at plus 1.1 degrees. The models had correctly predicted the rapid warming in October. If their prediction of a leveling off for the rest of the winter holds, then the January 2019 ONI would be close to plus one, which is the dividing line between a weak and a moderate El Niño. Accordingly the CPC's outlook for the upcoming winter (three months, December through February) issued two weeks ago expects an El Niño pattern across the country. Their outlook puts Tucson's odds into wetter-than-average territory, consistent with the plot above, where of the 24 winters in El Niño territory in January, 15 had above average precipitation, 14 of the 24 were above 4.1 inches. For the 13 weak El Niño winters alone, the two decades of the 1950's and the 2000's are tilted toward below average; the decades of the 1970's through the 1990's, along with so far the decade of the 2010's are tilted toward above average. The fact that the El Niño winter three years ago was below average is unlikely to have ushered in a new era of below average El Niño winters, not anymore than the winters of 1984-1985 or 1967-1968 ushered in new eras of above average La Niña winters. This coming winter's precipitation in Tucson might not be above average, but it more likely will be.

Saturday, January 14, 2017

Coming Spring Wildflowers

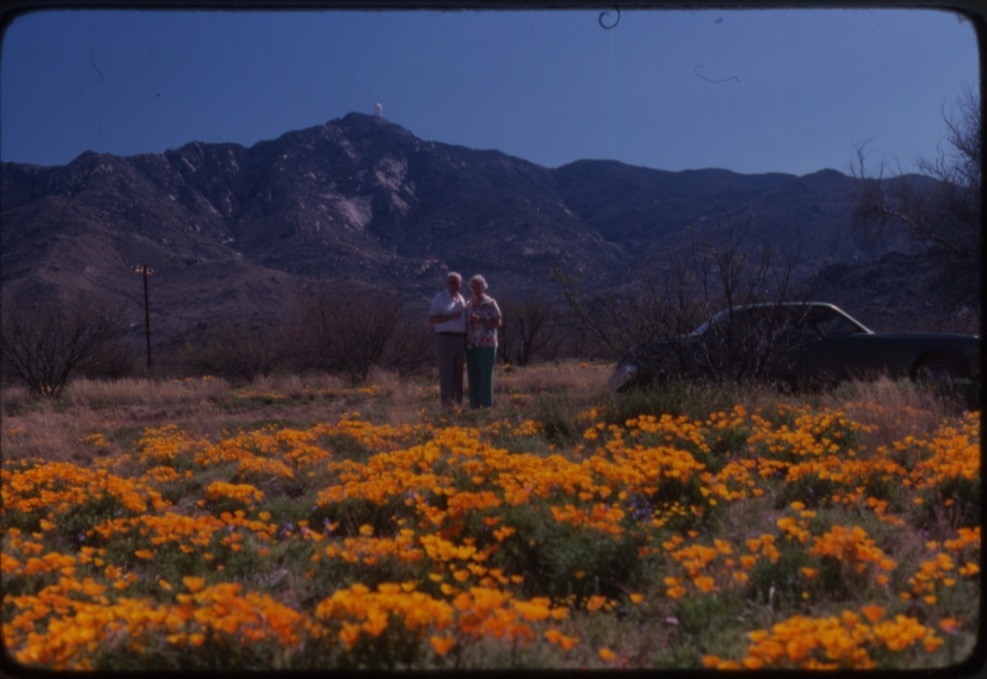
Repeated rainfalls this winter (e.g., tonight, more next weekend) could make for abundant spring wildflowers in March. I took this picture out near Kitt Peak when my parents were visiting way back in 1978.

This year since October 24 I've received a little over 3 inches. That total is nothing to get excited about; in most winters most of that would have fallen in just two or three big events. But this year's rain (so far, not counting tonight or next weekend) has been spread across 13 distinct events, each no more than half an inch. Between events there have been many very dewy mornings. Last year up to this point was similar, except for the dewy mornings, and except that last year's three-inch-plus total for the same period was concentrated in just two big events. As I recall last year, unlike this year, there were several windy airmasses that thoroughly dried things out between events. Also last year the rain mostly shut down after early January; between January 7 and March 7 there were only two events, which produced a total of 0.15 inch. This year's mid-to-late January will certainly be better. Just hope the seeds did not all get a false start last year.

Thursday, February 11, 2016

Will Tucson Get Beyond The Middle?

[Update March 30: Tucson didn't even make it to the middle.] Back at the end of September, I showed a scatterplot of the combined total November through March precipitation at Tucson airport for each of the previous 66 years versus the Oceanic Niño Index (ONI, defined by the Climate Prediction Center) for January, i.e. for the middle of each of those five-month winters. I noted back then that, of the eight previous winters for which the January ONI was greater than +1.0 (i.e., moderate-to-strong El Niños), all eight of those winters were in the upper one-third of the five-month precipitation totals. Below is the same plot, but now with an additional point, labeled 2016 so far.

What can be said for this strong El Niño winter is that at least this year's five-month total won't be in the bottom one-third (assuming that we'll get at least a third of an inch between now and the end of March). [Didn't happen! Only 0.11 inch from mid-February through March.] After the jet breaks under the West Coast ridge near the end of next week, it would not be too crazy to hope for an inch of rain in the last week of February, and then another inch in March. That would put the five-month total just barely above the middle 1/3—comparable to the 1957-1958 El Niño winter, but not even as good as last winter, and nowhere near the 1997-1998 winter that might have been dreamed of.
(The Tucson total precipitation since October 1, 4.59 inches, is still almost an inch above normal. But half of this year's since-October-1-so-far total fell in the month of October.)

Wednesday, September 30, 2015

Upcoming El Niño (continued), Tucson winter

In a post eight weeks ago, I showed a scatterplot of the combined total September plus October precipitation at Tucson airport for each of the last 65 years versus the Oceanic Niño Index (ONI, defined by the Climate Prediction Center) for October of each year. This year the airport has had 2.40 inches in September (and more to come next week), which already puts this year's September-October total well above the median for the last sixty-five years. So far this year's September-October total is in the middle of the pack relative to the eight years that had an October ONI greater than +1.0 (as this year is almost sure to have).

The plot in this post is similar to the earlier post's September-October plot, except that now in this plot the Tucson airport rainfall is totaled for the five successive winter months of November through March, and the ONI is for January (the middle month of the five-month period). Selected years are labeled (the year is for the end of the five-month period).

I'm still no fan of drawing a straight line through the data points. Instead, the important consideration for this upcoming winter is that, of the eight previous winters for which the January ONI was greater than +1.0, all eight of those years are in the upper one-third of the five-month precipitation totals. No matter who in the Southwest gets clobbered this winter, Tucson will at least get decent pieces of the action. It's easy to forget that last winter's November through March total (the point labeled 15) was already the 12th-wettest among the past 65 years. If this coming winter were only to match last year's total, it would still be a respectable showing for a moderate-to-strong El Niño winter.

I'm a contrarian in going with a 5-month winter, but that's the way it is in Tucson. Freezing temperatures can occur in November and March, although they are more common from December through February. Winter weather patterns can bring rain to Tucson in November and March, although on average they do so more often from December through February. It's important to bear in mind that even El Niño winters are feast or famine—there can be periods lasting weeks, even a month or more, when the jet stream gets locked into a pattern unfavorable for rain in the Southwest. During the 1972-1973 El Niño most of Tucson's winter rain, 3.5 inches, came in November and March, while only 2.27 inches came in December through February. Similarly, 1957-1958's November plus March outperformed December through February. Conversely, and more typically, of the 10 inches in the five-month winter of 1965-1966, 9 inches came during December through February.

Wednesday, February 20, 2013

Snow in Tucson

Noon today, Feb 20, about a mile north of 1st and River.

Monday, March 26, 2012

November through March

Safe to say that we won't be getting any more rain in Tucson this month. That means that the total at the Tucson airport for these five winter months, November through March, will be 3.48 inches, which is about 4.5 times the total for the same period last year, and just a little below the average for those five months over the last 60 years. I had about an inch more than the airport. That plus the fact that we did not have a late freeze is making the plants look much better this year. In my previous post, I had suggested that there were two winters, 1974-1975 and 1999-2000, that would serve as good analogues for this past winter in Tucson. In fact this past winter's rainfall was much better than those earlier second-year-of-La-Niña-in-a-row winters.

Since chatter about La Niña has ceased, it might come as a surprise to learn that those conditions are still in place, although weakening. March will probably be close to the end for La Niña, so the ocean temperature anomaly will have averaged about -0.75 C over the five-month winter period. For much of the rest of the country, the last two winters, both La Niñas, have been about as far apart as winters can get. So much for a repeat of last winter.

Thursday, November 3, 2011

Double La Niña, and Tucson Winter Rain

La Niña will probably be with us again, and so the mantra in many places has been that this winter will be a repeat of last winter. But rain is coming to Tucson tomorrow night, and perhaps again on Monday. That expectation has temporarily dampened the chatter here. Eventually we will dry out again for an extended period—that happens every winter regardless of ENSO status—and the La Niña buzz will return. I predict that the total rainfall at the Tucson airport over the next five months, November through March, will be two to four times what it was for the same period last year. That is an easy call, because last year was one of the driest over the last sixty years for that five-month winter period.

In my post a little over a year ago, I plotted Tucson total rainfall, November through March, versus the ocean temperature anomaly used to officially delineate ENSO phases (my plot, as detailed in that earlier post, displays an average of the ocean anomaly over the entire five months). My point about rainfall for this year's current and upcoming five winter months is the same as it was last year. That is, based on what happened in the past, a range of possibilities should be expected: from well below normal to just below normal. But what about the fact that this would be the second La Niña winter in a row?

In the table below are data for selected years from my earlier plot, limited to four (including this one) recent extended periods of cool ocean temperatures following moderate to strong El Niños (red). Two of those winters with cool ocean temperatures came close but did not quite qualify as La Niña (blue), and so the ocean temperature anomalies for those two years are unshaded. Both 12 and 37 years ago at this point we were in the middle of not only a double but a triple La Niña. (Officially, La Niña ended for a few months during the summer of 2000, as it just did during the summer of 2011, but then redeveloped the following winter.) So the two winters of 1974-1975 and 1999-2000, each having come two years after an El Niño, look like good analogues for this winter. The rainfall totals for those two winters, 2.58 inches and 1.22 inches, offer a little more hope for Tucson this year than just a repeat of last winter.

November through March, Ocean Temperature Anomaly and Tucson Rain
37 years ago | 27 years ago | 12 years ago | Now
Winter Ocean Rain | Winter Ocean Rain | Winter Ocean Rain | Winter Ocean Rain
72-73 +1.59 5.77 | 82-83 +2.08 6.81 | 97-98 +2.17 8.38 | 09-10 +1.59 4.94
73-74 -1.84 1.95 | 83-84 -0.49 2.94 | 98-99 -1.22 1.13 | 10-11 -1.25 0.73
74-75 -0.70 2.58 | 84-85 -0.90 6.74 | 99-00 -1.43 1.22 | 11-12 <-0.5? ?
75-76 -1.39 1.83 | 85-86 -0.37 4.51 | 00-01 -0.56 3.94 | 12-13 ? ?

The winter of 1984-1985 is a different story. It, along with the winter of 1967-1968, was a La Niña outlier on my earlier plot. Both of those La Niña outliers occurred in the second year after an El Niño. But each of them also followed a winter that did not quite qualify as La Niña. For that reason, it may be appropriate to dismiss those years as completely irrelevant to this year's interactions over the Pacific, since last year was most definitely a La Niña winter. But I'm not so sure as I look upstream at storms over the Pacific these last few days evolving in a way that they tend to do more often in El Niño years. So I will hedge my prediction and say that there is a slight chance that this year could be another stray, errant La Niña winter that brings above normal precipitation to Tucson.

Tuesday, March 29, 2011

It Was A Dry Winter

in Tucson. Last October I posted about the oncoming La Niña winter in Tucson. Included with that post was a plot meant to illustrate that, based on the previous sixty years, the then oncoming La Niña winter had a range of possibilities for total rainfall, from well-below average to just-below average. The vertical scale in that plot is the rainfall total for a five month period extending from November through March. It is now close to the end of March, so this 61st five-month winter period is almost over. We aren't going to get any more rain in the next two days. Tucson airport will have had a total of 0.73 inches for November 2010 through March 2011, making it the second lowest November-March period in the last 61 years. The lowest was just five years ago, and that winter did not quite qualify officially as a La Niña winter. This past winter's nearest dry neighbors in the moderate-to-strong La Niña category were 1970-1971, 1998-1999, and 1999-2000. You can identify those three previous winters in the plot by noting the color-coding for the decades. (Although the March sea surface temperature anomaly in the Niño 3.4 region is not yet available, the average over the five-month period should work out to about -1.25 °C.)

My rainfall total for this most recent five-month winter period was 1.64 inches, more than twice that of the airport. Five years ago, when the airport had it's driest November through March, I also had about twice what the airport had. (I don't get twice as much as the airport on average.) To some extent the driest winters at the airport are just dumb luck, with rare showers in an already dry year happening to miss the airport.

Fortunately, within a day's drive both west and north of Tucson it has been a wet winter. Colorado River water inflow to Arizona is expected above normal. The fact that demand exceeds long-term supply in Arizona won't have to be reckoned with for a few more years.

Thursday, February 24, 2011

Good Chance of Snow in Tucson Sunday Morning

The last few times before this, over the last few years, when the prospect of accumulating snow in Tucson has been played up, I have been skeptical. The most likely scenario always was for drier air to arrive with the coldest air. This time is different. Before the arctic air turns east and moves rapidly toward Tucson overnight Saturday, it will have had a long time to pick up moisture from the Pacific while hugging the California coast from San Francisco (overnight Friday) to Los Angeles (Saturday evening). The system will be moving east through Tucson rapidly on Sunday, and drier air should sweep in well before noon (per the consistent run-to-run GFS 700 mb RH progs for 18Z). And the heaviest precipitation should be all rain both in the foothills and in the valley until almost sunrise on Sunday. But there could well be a few hours of light, wet snow either side of sunrise when about a half-inch, maybe an inch average accumulates.

Thursday, October 7, 2010

La Niña and Tucson Winter Rain

Soon media attention will focus on the monthly and weekly outlooks from the Climate Prediction Center, which are consistently expecting a possibly moderate to strong La Niña this winter. Much will be said, some of it accurate, about La Niña's effects on Tucson rainfall.


Below is a plot of winter rainfall at the Tucson airport over the last 60 years1 as a function of sea surface temperature anomalies in the Niño 3.4 region.2 The SST anomalies are averaged over five-month periods of November through March, while the precipitation is totaled for the five-month periods.3

The winters are color coded by decade, as labeled. The decade is for the beginning of the 5-month period, so the most recent winter (2009-2010) is included in the 2000's. The two lines are manual fits to the 90th percentiles and the 10th percentiles of the total precip. On each line the abrupt change in slope is intentional, emphasizing aspects of the data distribution that may be overlooked when attention is focused on the means. Noting first the right side of the figure, El Niño is not so much about well-above normal winter rainfall. Very wet winters occur even without El Niño. More striking, especially as you move into the moderate and strong El Niño territory, beyond +1 °C, is the sparsity of winters with rainfall below average (60-year mean 3.89 inches). Last winter's moderate to strong El Niño, at 4.94 inches easily satisfied the “not below average” expectation. Similarly, La Niña's are not the only times to be concerned about the possibility of well-below normal rainfall. Several neutral winters have been well below normal. Attention instead is focused on the complete absence of above normal rainfall for moderate and strong La Niñas. There are two weak La Niña winters that had well-above normal rainfall. Both of these followed moderate to strong El Niños, but by two years, not one. The intervening year was very dry in both cases.


In summary, there will be times this winter, as there are in every winter, when the weather pattern shifts to one that favors periods of rain in Tucson. With La Niña these wet patterns will probably be relatively infrequent and/or short-lived. It's very unlikely that the total precipitation for the winter will be above average, but it's plausible that it could be close to average. It's also possible that it could be well below average.


  1. Source is the Western Regional Climate Center.

  2. Source is the CPC link to the Extended Reconstructed SST (ERSST) anomalies.
    As explained in the CPC updates, the Oceanic Niño Index (ONI) is defined as the three-month running-mean of SST departures in the Niño 3.4 region. Since the ONI is already a 3-month average, the 5-month average for NDJFM, plotted in the figure above, is approximately, but not quite the same as an average of the ONI for NDJ, DJF and JFM, but weighted by (2/5, 1/5, 2/5).

  3. Why a 5-month season, instead of 3 months? Because there's not much difference between weather systems that manage to produce rain in Tucson during the “border” months of November and March vs. Tucson rains during the standard meteorological winter of December, January and February. Winter rains in Tucson are often separated by extended dry periods, sometimes a month or more, and so I think the longer period gives a better picture. Years that manage to produce significant rain in November and March deserve the extra credit.